

Foreword
Technical analysis is a trading framework used to evaluate investments and identify entry/exit opportunities in the market. This methodology uses statistical trends gathered from trading activity, metrics used include price movement, momentum, and volume. One such tool is an oscillating indicator called the Relative Strength Index (RSI). This indicator relies on the concept of a Relative Strength of a stock.
 “You get recessions, you have stock market declines. If you don't understand that's going to happen, then you're not ready, you won't do well in the markets." - Peter Lynch, Mutual fund manager
Definition
The Relative Strength Index is a momentum oscillator that measures the magnitude and direction of stock price changes. Developed by J. Welles Wilder in 1978, it is intended to outline the historical and current strength, or weakness, of a specific share or market. The RSI accomplishes this by relying on the closing prices of a specific, recent trading period.
Traditionally, this oscillator is calculated for a period, n of 14 days. By quantifying the relative strength of a particular security over a finite appropriate span of time, we are able to measure the momentum - the direction (positive or negative) and magnitude (amount of change) of price movement. To calculate RSI, we must first know the RS, The equation is given as follows:.
RS = (AVG Closes Up in 'n' Periods) / (AVG Closes Down in 'n' Periods).
Indicator and direction
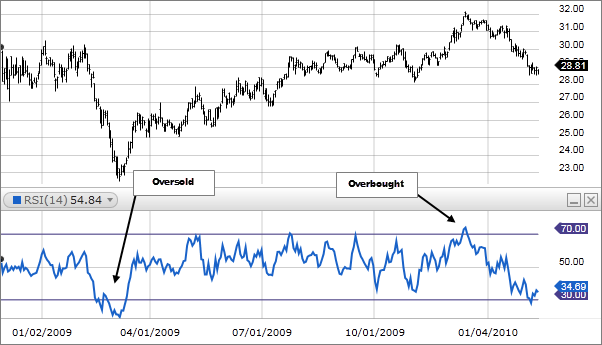
As an oscillator, its values move between the extremes of 0 and 100. Typical interpretations of the RSI are that values of 70 or above indicate that a security is becoming overbought or overvalued and may be primed for a trend reversal or corrective pullback in price.
An RSI reading of 30 or below indicates an oversold or undervalued condition. In an uptrend or bull market, the RSI tends to remain in the 40 to 90 range with the 40-50 zone acting as support. During a downtrend or bear market the RSI tends to stay between the 10 to 60 range with the 50-60 zone acting as resistance. These ranges will vary depending on the RSI settings and the strength of the security’s or market’s underlying trend.
Significance
It is especially useful in evaluating whether a stock has been overbought or oversold in recent history. This particular tool is a leading indicator as its value moves/changes before the market price is established after a given time period. These sorts of indicators are most useful when ascertaining whether to sell or hold a stock, as it helps you predict the price trajectory of a stock in the near future.
Limitations
RSI isn't always helpful, given that it can move without featuring a clear trend for a long time. Its values can give false indications to sell or buy a security, as there are multiple factors that determine a stock's closing price on any given day. It is worth noting that this is the most likely occurrence with an RSI following recent sudden sizable price changes. Furthermore, the RSI alone does not accurately reflect changes in stock prices caused by factors outside the company’s control. For example a stable company with a historically strong stock (with more average positive closing prices than negative) can have an RSI above 70 or below 30 should a natural disaster or global pandemic, for example, hamper the company’s ability to meet its customer / shareholders' demands. The RSI alone would therefore not be incredibly useful in determining whether to acquire or liquidate more shares in this company. Therefore,other oscillators like Moving Averages, Moving Average Convergence Divergence (MACD), Money Flow Index (MFI) or Rate of Change Indicator (ROC) should be used cohesively along with information provided by RSI to make decisions around stock acquisitions and liquidations.
Disclaimer
DO NOT BASE ANY INVESTMENT DECISION UPON ANY MATERIALS FOUND ON THIS WEBSITE. We are not registered as a securities broker-dealer or an investment adviser either with the U.S. Securities and Exchange Commission (the “SEC”) or with any state securities regulatory authority. We are neither licensed nor qualified to provide investment advice. We are just a group of students who diligently follow industry trends and current events, then share our own advice, which reflects our personal position in the market.