

Foreword
Technical analysis is a trading framework used to evaluate investments and identify entry/exit opportunities in the market. This methodology uses statistical trends gathered from trading activity, metrics used include price movement, momentum, and volume. One of the most used indicators is the simple moving average (SMA). This indicator is also the base for many others including death crosses & gold crosses.
“Technical analysis is a skill that improves with experience and study. Always be a student and keep learning.” - John Murphy
Definition
Moving averages are one of the core indicators in technical analysis, and there are a variety of different versions. SMA is the easiest moving average to construct. It is simply the average price over the specified period. The average is called "moving" because it is plotted on the chart bar by bar, forming a line that moves along the chart as the average value changes.
A simple moving average (SMA) is an arithmetic moving average calculated by adding recent closing prices and then dividing that by the number of time periods used. Short term averages (periods of 10,20,30) respond very quickly to changes in the price of the underlying asset while longer term averages (100,200) are slower to react.
Indicator and direction
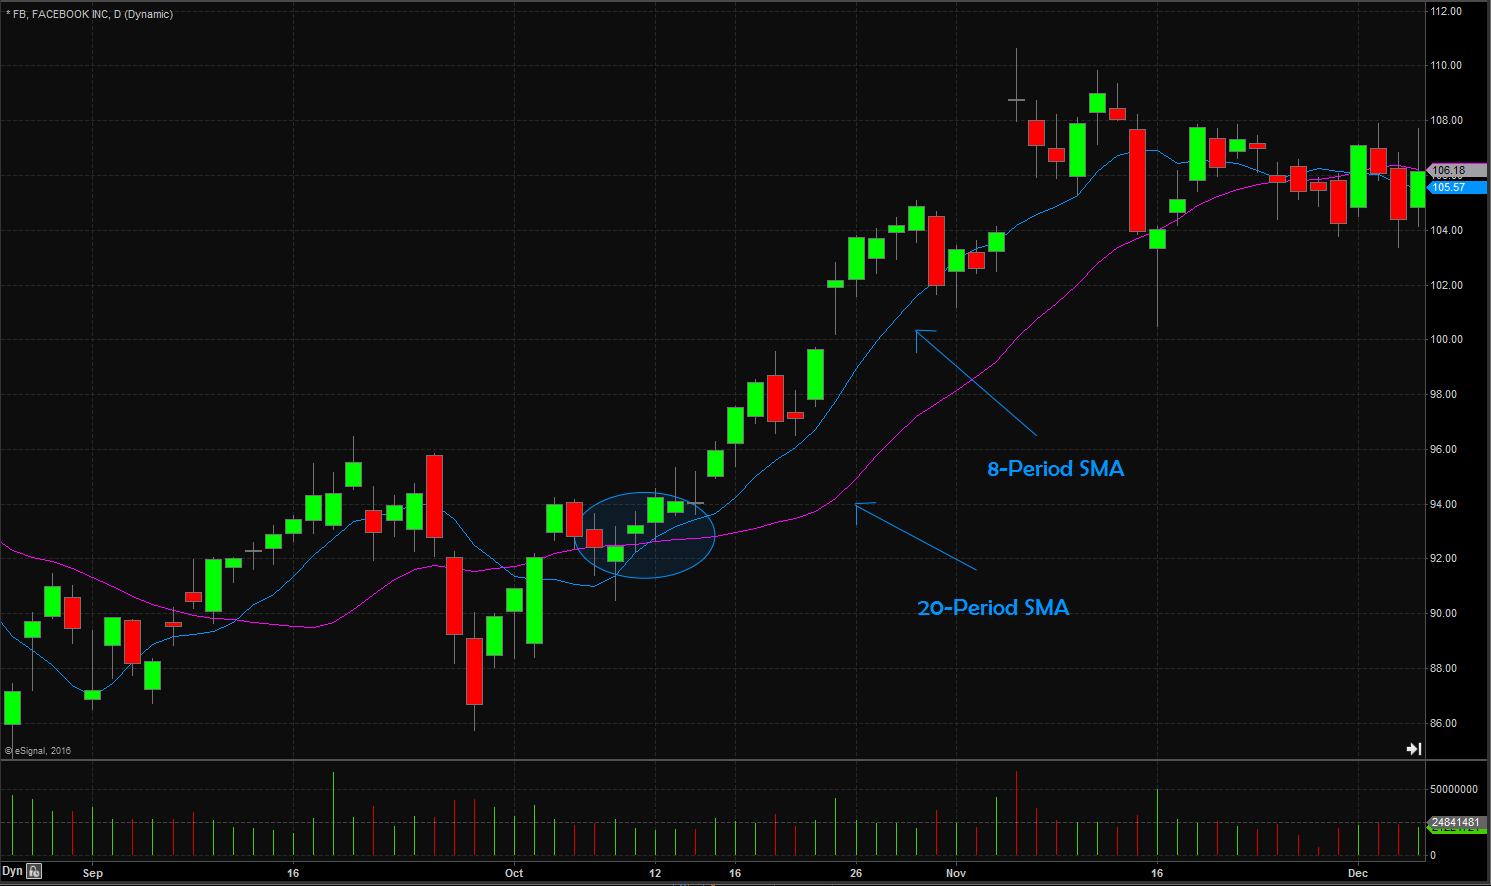
Simple moving average targets are customizable over a variety of time periods (Stock Alarm supports 5 ,30,50,100,200). A simple moving average smoothens out volatility and makes it easier to spot trends in a stock’s price movement. Normally itis as simple as realizing that if a stock’s SMA is pointing up then it is on a bullish trend, if it’s pointing down then it is on a bearish trend. The shorter the time frame the less smooth the trendline will be (due to taking in more volatility into account). Short term SMAs are much closer to the source data while longer term SMAs try to smoothen out the data.
Significance
Simple moving averages are an important analytical tool used to identify current price trends and the potential for a change in an established or mature trend. Many people like to mix and match SMA triggers with a variety of periods to get a better sense of where the trend is going.
Limitations
There are diverse schools of thought when it comes to technical analysis and the SMA is no exception. Many traders believe that newer data will better reflect the stock price’s current trend while others feel that placing unequal significance on any section of the SMA’s time period will bias the indicator. The SMA may end up relying too heavily on older data since it will treat the 1st day’s price & momentum with the same weight as the 100th day.
Disclaimer
DO NOT BASE ANY INVESTMENT DECISION UPON ANY MATERIALS FOUND ON THIS WEBSITE. We are not registered as a securities broker-dealer or an investment adviser either with the U.S. Securities and Exchange Commission (the “SEC”) or with any state securities regulatory authority. We are neither licensed nor qualified to provide investment advice. We are just a group of students who diligently follow industry trends and current events, then share our own advice, which reflects our personal position in the market.